Density altitude is the altitude in the standard atmosphere that corresponds to the air density where you're actually flying. That single number tells your airplane how to perform. When density altitude is high, your engine produces less power, your propeller bites less air, and your wings need more speed to generate the same lift. The practical result: a longer takeoff roll, a weaker climb, and a landing that covers more runway than your logbook experience suggests.
Two mitigation actions you can apply right now: pull out your Pilot's Operating Handbook (POH) and look up performance numbers for the actual density altitude you've computed, and schedule your flight for early morning when temperatures are lowest.
The three factors that drive density altitude, in order of practical importance:
Density altitude is the single most underestimated performance factor in general aviation, and computing it correctly before every flight is the habit that separates safe pilots from lucky ones.
| Point | Details |
|---|---|
| Compute density altitude every flight | Use pressure altitude plus the temperature correction formula, an E6B, or a verified online calculator before every departure. |
| POH charts are non-negotiable | Look up actual takeoff distance and climb rate at your computed density altitude and gross weight — never estimate from feel or past experience. |
| Hot, High, and Heavy multiplies risk | Each factor degrades performance independently; combined, they can make a familiar runway genuinely dangerous. |
| Brief your abort point before every takeoff | Define a specific runway marker and commit to closing the throttle if you're not at expected speed by that point. |
| Parrillo Air Services builds this habit | Scenario-based preflight training at Parrillo Air Services covers POH chart reading and abort-point briefings as standard practice from day one. |
Density altitude is pressure altitude corrected for nonstandard temperature. That one sentence is the definition, but the distinction between the three altitude terms trips up a lot of students, so here's how they differ.
Pressure altitude is what your altimeter reads when you set the Kollsman window to 29.92 inHg. It reflects the atmospheric pressure at your location relative to the standard atmosphere, which is defined at sea level as 15°C (59°F) and 29.92 inHg. Pressure altitude is the starting point for every density-altitude calculation.
True altitude is your actual height above mean sea level, which is what the altimeter shows with the local altimeter setting (QNH) dialed in. Field elevation is a form of true altitude. You'll see it on sectional charts, in airport information, and in ATIS/ASOS broadcasts. True altitude tells you where you are geographically; it does not tell you how the airplane will perform.
Density altitude adds the temperature correction on top of pressure altitude. When the air is warmer than the standard atmosphere predicts for a given pressure altitude, density altitude rises above pressure altitude. On a standard day, they're equal. On a hot day, density altitude can be thousands of feet higher than the field elevation.
Here's a quick reference for when each term appears:
The standard atmosphere reference matters here. At sea level, standard conditions are 15°C (59°F) and 29.92 inHg. Every degree above standard temperature at a given pressure altitude pushes density altitude higher. At 5,000 ft pressure altitude, the standard temperature is 5°C (41°F). If the actual OAT is 30°C (86°F), you're 25°C above standard, and density altitude climbs accordingly.
There are four practical methods, and you'll likely use all of them at different points in training.
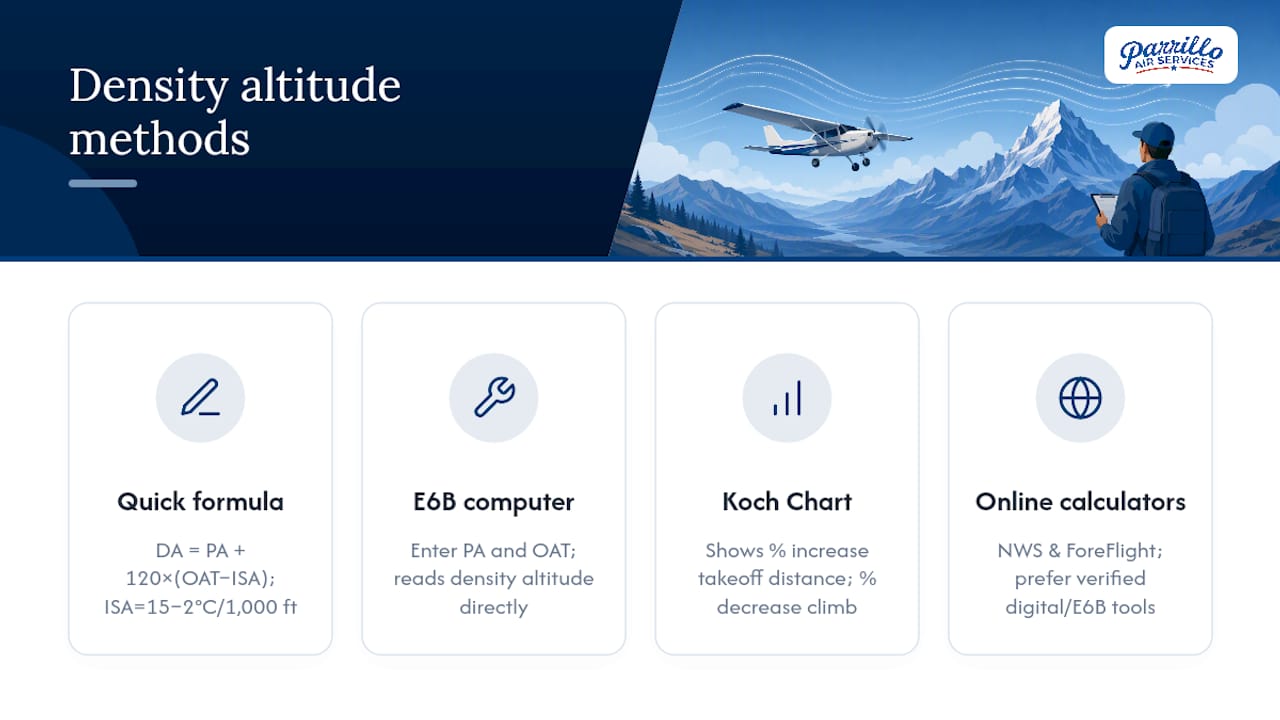
Method 1: The quick formula. The most common approximation is:
Density Altitude = Pressure Altitude + 120 × (OAT − ISA Temperature)
OAT is outside air temperature in °C. ISA temperature at a given pressure altitude is 15°C minus 2°C per 1,000 ft of pressure altitude. The factor 120 converts the temperature deviation into feet of density altitude.
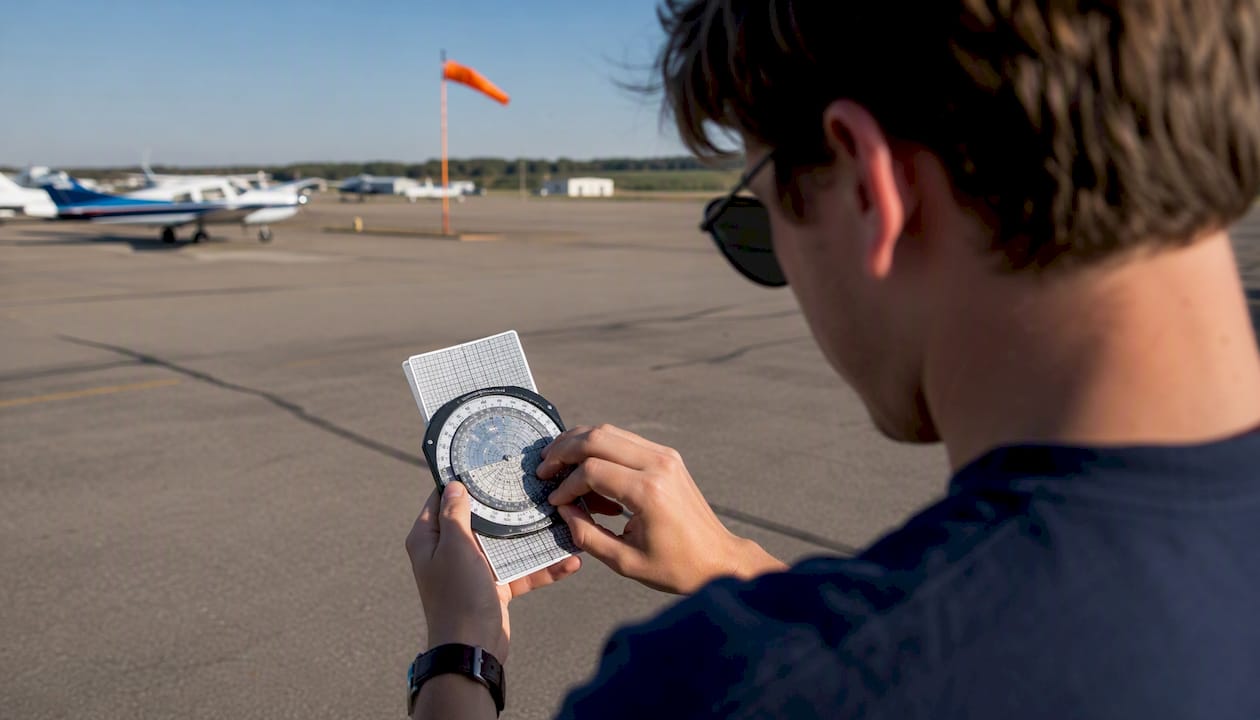
Method 2: E6B flight computer. The mechanical or electronic E6B has a dedicated density-altitude window. Enter pressure altitude and OAT, and it reads out density altitude directly. Fast and reliable for preflight.
Method 3: Koch Chart. The FAA's Koch Chart links temperature and pressure altitude to percentage increases in takeoff distance and percentage decreases in rate of climb. It's a quick visual tool when you don't have POH data immediately available. At 100°F and 6,000 ft pressure altitude, the Koch Chart shows a large increase in takeoff distance.
Method 4: Online calculators. The National Weather Service provides a density-altitude calculator, and apps like ForeFlight include it in their weather tools. Kestrel Instruments and similar sources recommend a verified digital calculator or E6B over mental shortcuts, especially when computed density altitude approaches or exceeds POH limits.
Conditions: Airport field elevation 4,500 ft MSL. Altimeter setting 29.72 inHg. OAT 32°C.
| Input | Value |
|---|---|
| Field elevation | 4,500 ft MSL |
| Altimeter setting | 29.72 inHg |
| Pressure altitude | 4,700 ft |
| OAT | 32°C |
| ISA temp at 4,700 ft | 5.6°C |
| Temperature deviation | +26.4°C |
| Density altitude | ~7,868 ft |
That's nearly 3,400 ft above field elevation. Your airplane will perform as if it's at 7,868 ft even though the runway is at 4,500 ft.
On humidity: High humidity reduces air density slightly further.
The mechanism is the same across all three systems: fewer air molecules per cubic foot of volume. Less mass flow through the engine, less air for the propeller to push against, fewer molecules for the wing to deflect downward.
Normally aspirated (non-turbocharged) engines are the most vulnerable. They ingest a fixed volume of air per cycle, so at high density altitude that volume contains less oxygen and less mass.
Turbocharged engines compress intake air, which partially compensates for lower density. They can maintain manifold pressure up to their critical altitude, above which they behave like normally aspirated engines. Hartzell Propeller's guidance notes that reduced propeller efficiency compounds the engine power loss: the propeller is also operating in thinner air and generates less thrust per RPM.
Your airspeed indicator measures dynamic pressure, not actual air speed. At high density altitude, the wing still stalls at the same indicated airspeed (IAS), because IAS is tied to dynamic pressure. But to reach that IAS, the airplane must move through the air at a higher true airspeed (TAS). A higher TAS means a longer ground roll before rotation, and it means you're covering more ground per second on approach and landing.
On a hot and humid day, the aircraft accelerates more slowly, needs higher true airspeed to produce the same lift, and has a reduced climb rate. Stall speed in IAS stays the same, but the ground speed at which you stall is higher, which matters for obstacle clearance on departure and runway use on landing.
Density altitude accounts for 7.3% of all U.S. aviation weather-related accidents. That share is disproportionate to how often pilots consciously check for it.
Pro Tip: For normally aspirated engines, lean the mixture for maximum power before takeoff when operating above approximately 5,000 ft density altitude, per your POH. For turbocharged engines, follow the manufacturer's specific mixture procedure — leaning aggressively before the critical altitude can actually reduce power. When in doubt, the POH procedure wins.
"Hot, High, and Heavy" is the phrase instructors use because each word represents a separate performance penalty, and the three stack multiplicatively, not additively.
Hot means temperature above standard. A 95°F day at a sea-level airport already pushes density altitude to roughly 3,000 ft before you account for field elevation.
High means field elevation. Mountain airports, high-desert strips, and even mid-elevation airports in the Rockies or Sierra Nevada start the calculation from a disadvantaged baseline.
Heavy means gross weight near or at maximum. A heavier airplane needs more lift, more runway, and more climb performance, all of which are already degraded.
Three scenarios where this combination bites:
During the takeoff roll, the cues are sluggish acceleration and airspeed that builds slowly. That's not a guideline to negotiate in the moment. It's a decision you make before you advance the throttle.
Pro Tip: Brief your abort point before every takeoff, not just high-density-altitude ones. Pick a specific taxiway or runway marker. If you're not at the expected speed by that point, close the throttle and brake. Predefined abort points remove the hesitation that kills people.
Work through this before every flight when temperature or elevation is a factor.
Questions to ask yourself during the briefing:
Operational mitigations beyond the checklist: fly early or late in the day, choose the longest available runway, consider a different departure airport if terrain is a factor, and split a heavy load across two flights.
The POH is the authoritative source for your specific airplane. No rule of thumb, Koch Chart, or online calculator replaces it for actual go or no-go numbers.
Here's the standard method for reading a takeoff performance chart:
Using the earlier example: density altitude ~7,868 ft, OAT 32°C, pressure altitude 4,700 ft.
A typical trainer POH might show the following at 5,000 ft pressure altitude and 30°C OAT (the nearest chart entries):
If your actual gross weight is 2,300 lb, interpolate halfway between the two rows: roughly 975 ft ground roll and 1,725 ft to clear 50 ft. If your runway is 3,000 ft with trees at the departure end, that's workable but not comfortable. A 2,500 ft runway with obstacles is a no-go.
The Koch Chart as a backup. When you don't have POH data for a specific airplane, the FAA's Koch Chart gives a percentage adjustment from sea-level standard performance. That's a rough approximation, not a substitute for POH data, but it's a useful reality check when you're evaluating an unfamiliar airplane or airport.
Pro Tip: Always lean for maximum power per POH before takeoff when the chart requires it. For turbocharged engines, the mixture procedure is different — follow the AFM exactly, because over-leaning before the critical altitude reduces power rather than increasing it.
The most common mistake isn't a math error. It's skipping the calculation entirely because the day looks fine. Clear skies and smooth air feel safe. But density altitude is invisible, and the Air Safety Institute notes that pilots frequently underestimate its effects on clear, hot days precisely because there's no visible weather to trigger concern.
Here are the errors that show up repeatedly:
Training drills that build reliable habits:
One teaching moment that sticks: a student once told me the airplane "felt fine" during a high-density-altitude departure from a mountain strip. It did feel fine, right up until the climb rate was 150 fpm with terrain ahead. The airplane wasn't broken. It was doing exactly what the POH predicted. The student just hadn't read the POH.
Pro Tip: Build a personal preflight mnemonic that includes density altitude. Something like WDAP: Weather (OAT, altimeter), Density altitude (compute it), Aircraft (POH charts), Plan (abort point briefed). Four steps, every flight, regardless of how benign the conditions look.
Density altitude is one of those topics that's easy to understand in a classroom and easy to underestimate on the ramp. The gap between knowing the concept and applying it under real preflight pressure is where training matters most.

At Parrillo Air Services in Lynchburg, VA, scenario-based instruction is built into the private pilot curriculum from the start. That means POH-focused preflight briefings are standard practice, not an occasional add-on. Students work through real performance chart calculations, practice abort-point briefings, and build the habit of computing density altitude before every flight, not just when conditions look obviously challenging. The FAA Part 61 programs at Parrillo Air Services give you the structured repetition that turns a textbook concept into a reliable preflight habit. If you're ready to train with instructors who take performance planning seriously, explore the flight training programs and find out how to get started.